The developer console: a tour of every tab
Know where to find keys, models, limits, spend, jobs and logs, and use the console to watch and debug your integration.
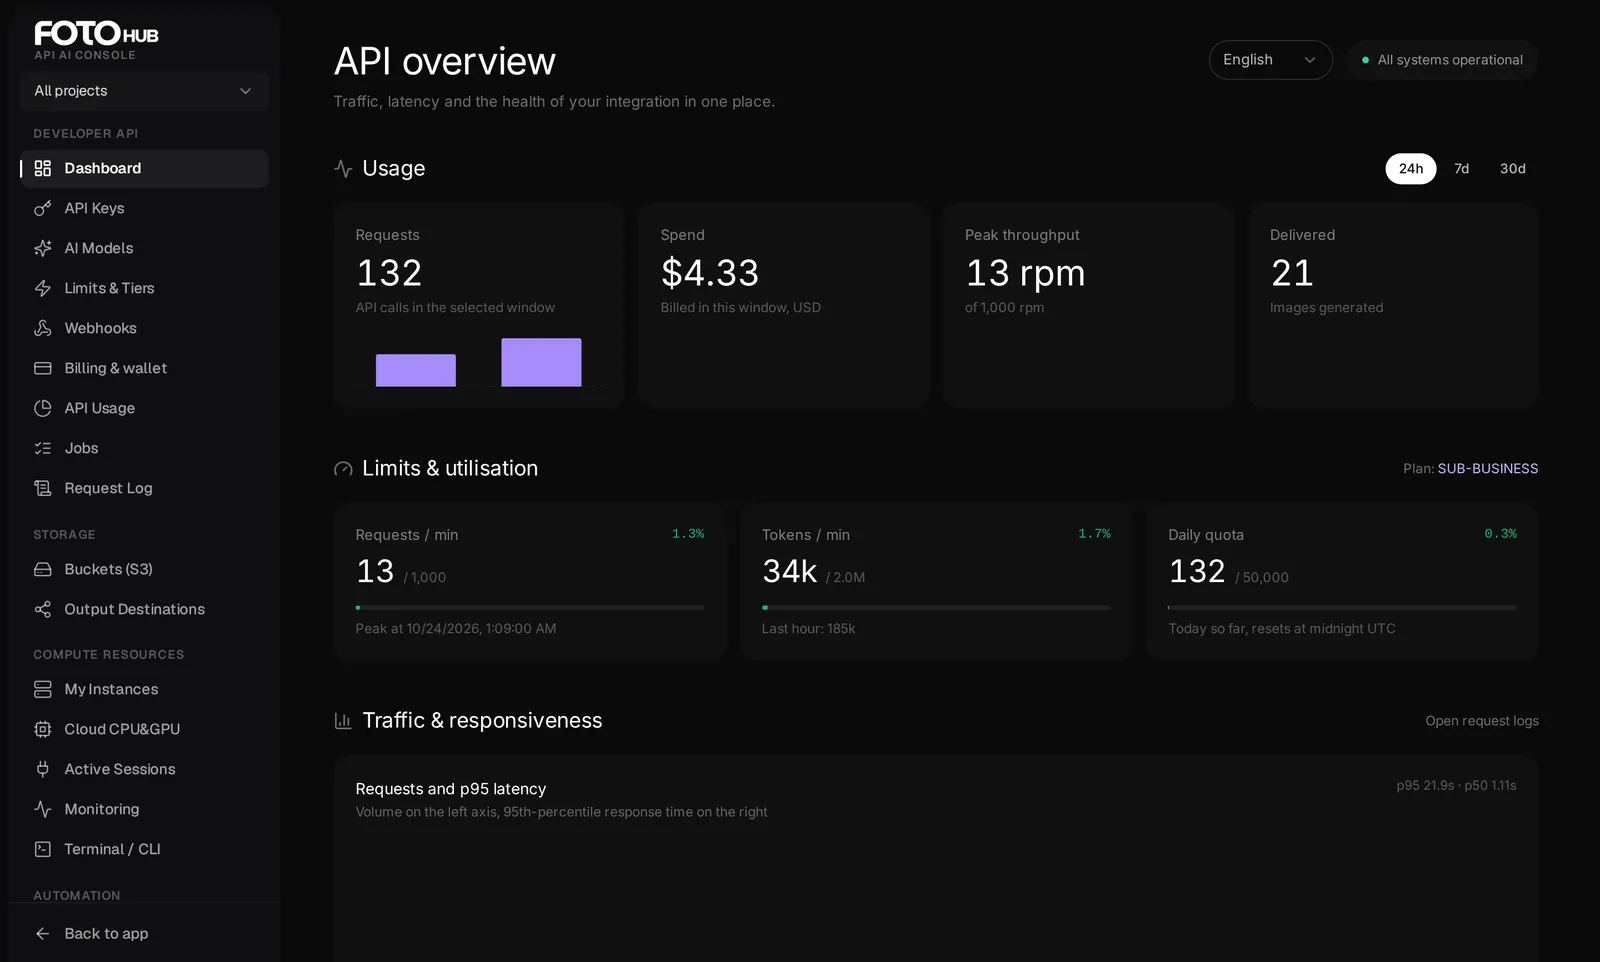
What the console is for
The console is the control panel for everything you do with the API: it creates your keys, shows which models you can call and what they cost, reports every request your code makes, tracks asynchronous jobs, and holds your prepaid wallet. It is separate from the creative studios, so a developer can live in it without touching the rest of the app.
- Open it Go to fotohub.app/console, or use API Console in the app's sidebar. You are signed in with your normal FOTOhub account; there is no separate login.
- Pick a project (optional) The selector at the top of the left rail narrows the API Keys list to one project, or shows All projects, the default. Projects group keys, for example staging and production, up to 3 at the top level, and a key you create while one is selected is filed under it. The Dashboard, API Usage, Request Log and Jobs always cover the whole account.
- Use the left rail Every tab is a normal link with its own address (
/console/keys,/console/logs, and so on), so you can bookmark one or open it in a new tab.
| Group | Tabs |
|---|---|
| Developer API | Dashboard, API Keys, AI Models, Limits & Tiers, Webhooks, Billing & wallet, API Usage, Jobs, Request Log |
| Storage | Buckets (S3), Output Destinations |
| Compute Resources | My Instances, Cloud CPU&GPU, Active Sessions, Monitoring, Terminal / CLI |
| Automation | Agents API |
Which tab answers which question
Most days you need three tabs, not fourteen.
| Tab | Open it when | Look for |
|---|---|---|
| Dashboard | you ask if it is healthy | success share, p95, Reliability failures, peak requests per minute |
| API Keys | a key is new, leaked or idle | status, last used, cost per key |
| Limits & Tiers | you see 429 or plan growth | requests per minute, next tier threshold |
| Billing & wallet | money moves or a call returns 402 | balance, cap, budgets, activity |
| API Usage | you compare models or costs | Billed and Cost per model, utilisation bars |
| Jobs | an async call is lost or failed | status, Took, Charged, refunded |
| Request Log | one call went wrong | status, timing split, Request ID |
- Morning, one minute: check the status pill, open the Dashboard on 24h, read the success share and the Reliability failures, note the balance.
- After a deploy: open Request Log, filter Errors, switch Live on (it refreshes every 10 seconds) and run a smoke test.
- Weekly: on API Usage (7d) compare Billed with Cost per model, scan Jobs for failures, revoke idle keys. Before a traffic spike, compare peak requests per minute with your limit and set a spending cap.
Dashboard: the health of your integration
The dashboard answers "is my integration healthy right now?" in one screen. Switch the window between 24 hours, 7 days and 30 days.
| Panel | What it shows |
|---|---|
| Requests, Spend, Peak throughput, Delivered | API calls, money billed in the window, the highest requests per minute reached against your limit, and tokens processed |
| Limits & utilisation | Requests per minute, tokens per minute and the daily quota, each with a bar showing how close you are |
| Traffic & responsiveness | Requests and p95 latency over time, the latency distribution, and where the time goes: rendering, file transfer or our own orchestration |
| Reliability | The status mix (2xx, 4xx, 5xx) and the most frequent failures, split by who owns the fix: 4xx means the request was rejected, 5xx means we failed |
| Wallet, Security, System | Balance and spend this month, a short security summary, and the health of the platform's services |
The success share beside Reliability is 2xx responses over all requests in the window, so rejected requests lower it too. Latency is p50, p95 and p99 rather than a mean: p95 is the time within which 95 percent of requests finished. Peak throughput is the busiest single minute against your requests-per-minute limit, because limits apply per minute; the percentage is not capped at 100, so a higher value means you went over.
Read the Reliability panel in two minutes
Goal. Last night's batch was slow and some images are missing: is the fix yours or the platform's?
Input you can copy.
Invented numbers for the reading, 24h window: 94.2% succeeded; Success (2xx) 942, Rejected (4xx) 53, Service error (5xx) 5; failures: 429 on /v1/ai/generate/image 41x, 400 on the same route 12x, 500 on /v1/ai/generate/video 5x.Why it works. 53 of 58 failures are rejections, so mostly yours. The 41 responses with 429 mean the batch outran your requests-per-minute limit: space the calls or raise the tier by topping up. The 12 with 400 point at a bad field, so expand them in Request Log. The 5 service errors are the platform's; check Jobs for the refunded mark.
API Keys, AI Models and Limits & Tiers
API Keys
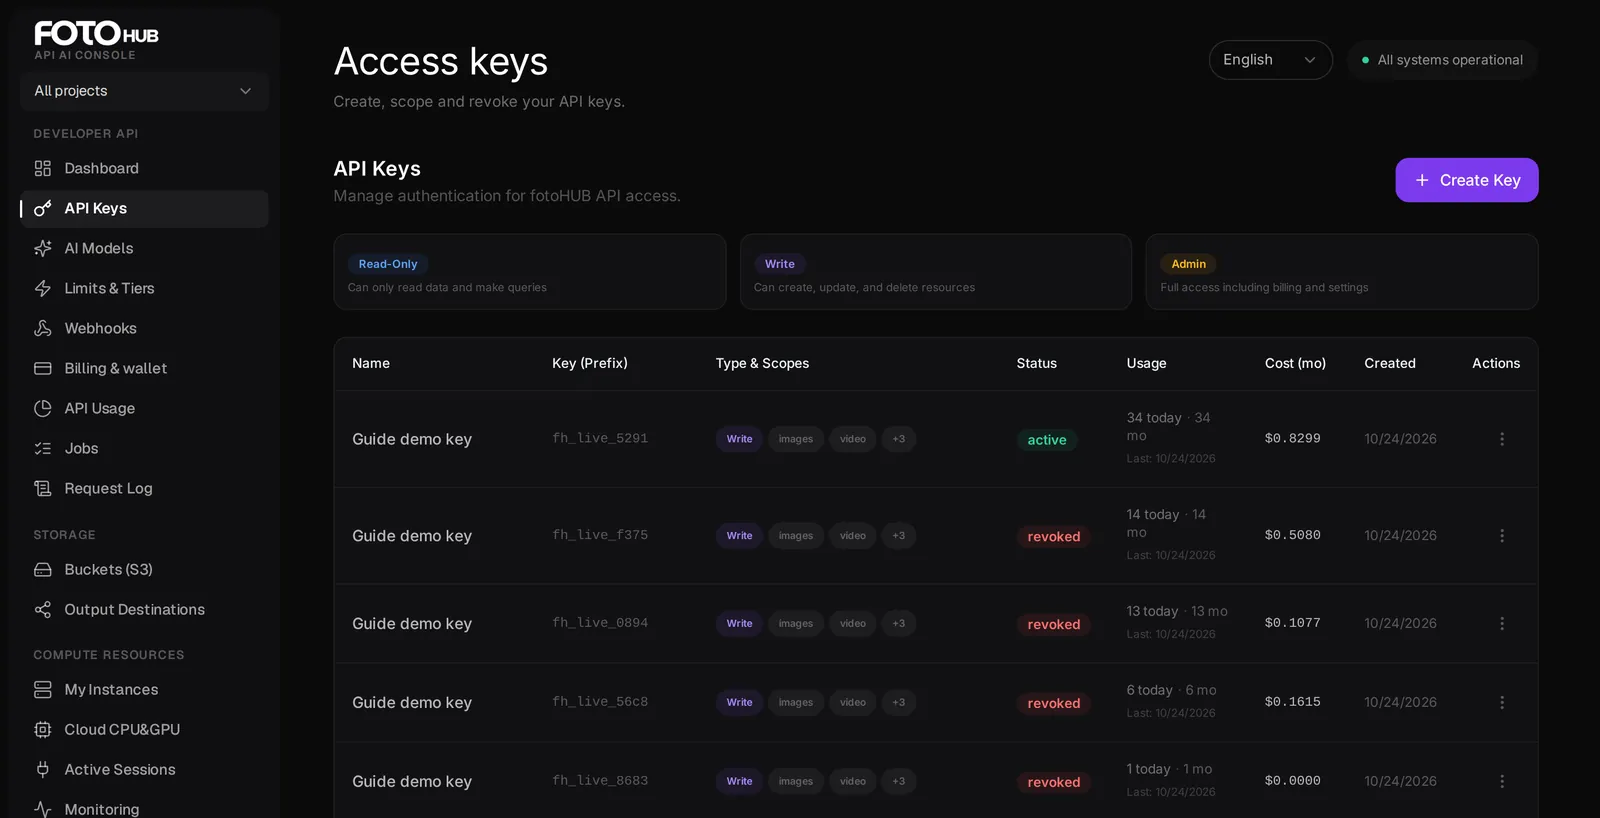
Create, scope, rotate and revoke keys. See the dedicated guide for every option.
AI Models
The live catalogue of everything the API can run, grouped into Audio, Chat, Image, Text, Utility and Video. Each row shows the model name and id, its category, the unit price, an estimated USD price, the endpoint to call and whether it is active. The totals at the top count available and unavailable models. Copy the id from here into your model field.
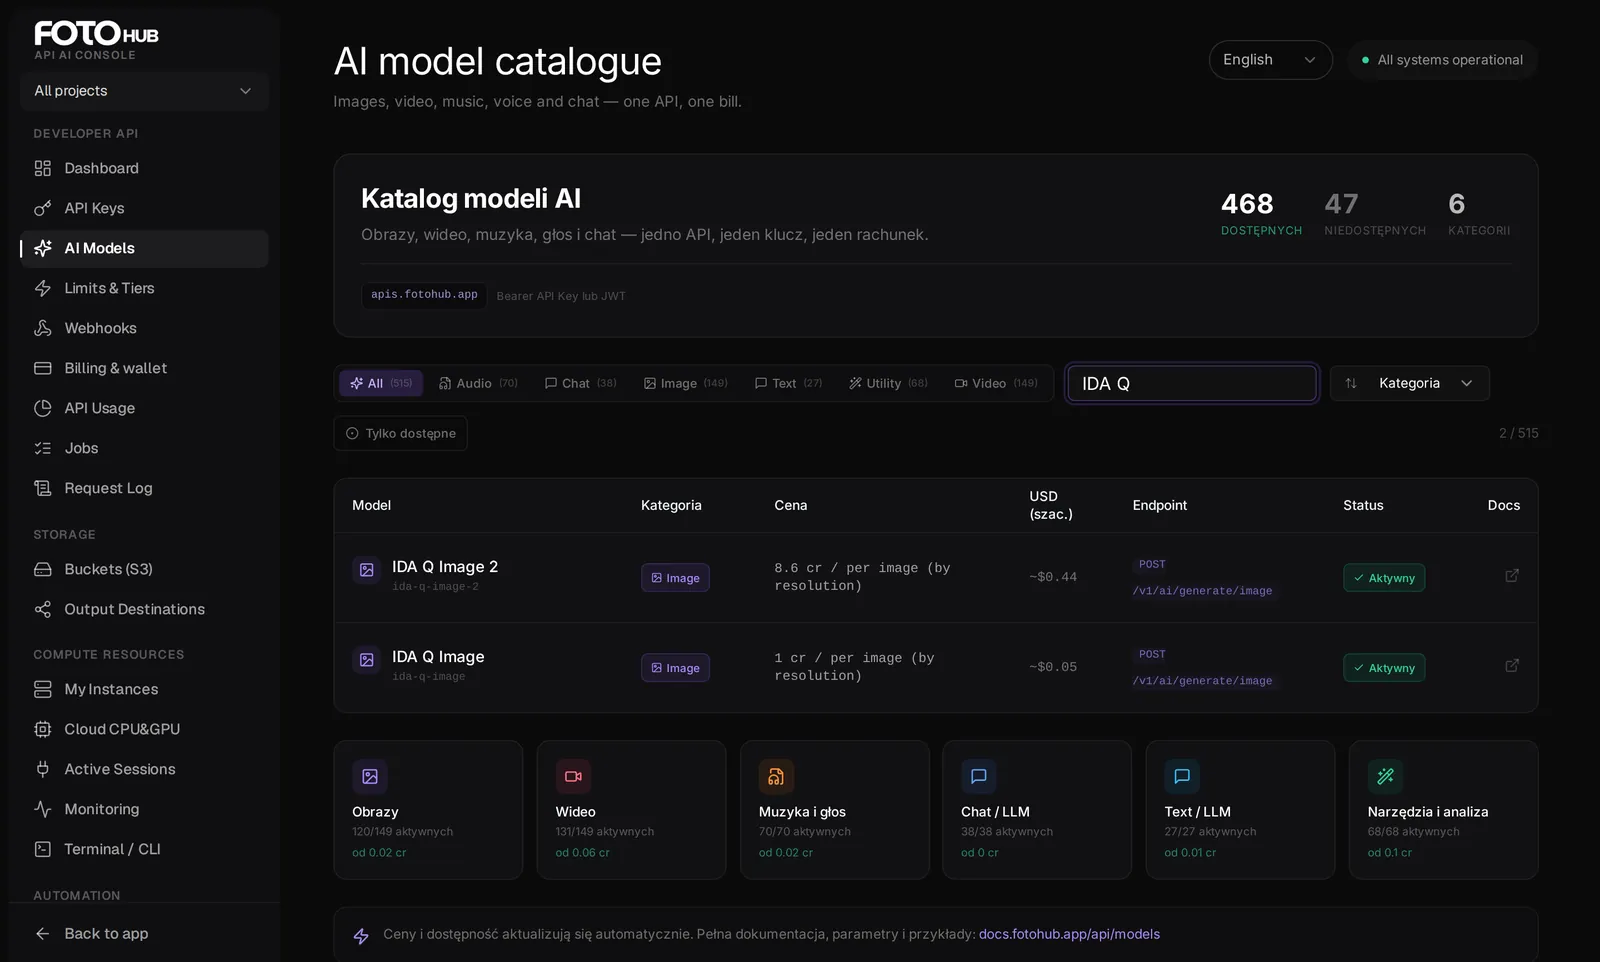
| Label | Meaning |
|---|---|
| DOSTĘPNYCH / NIEDOSTĘPNYCH | available / unavailable models |
| Kategoria, Tylko dostępne | category filter, show only callable models |
| Cena, USD (szac.) | listed unit price, estimated US dollars |
| Status: Aktywny | active and callable |
Treat the listed price as a guide. The exact price per model is in GET /v1/models and GET /v1/pricing, a planned request total in POST /v1/billing/estimate, and the amount billed in cost_usd of the call's response.
Limits & Tiers
Shows your current tier and its limits: requests per minute, concurrent jobs and storage, plus the thresholds at which the next pay-as-you-go tier switches on by itself. There is nothing to subscribe to; topping up the wallet is how limits rise.
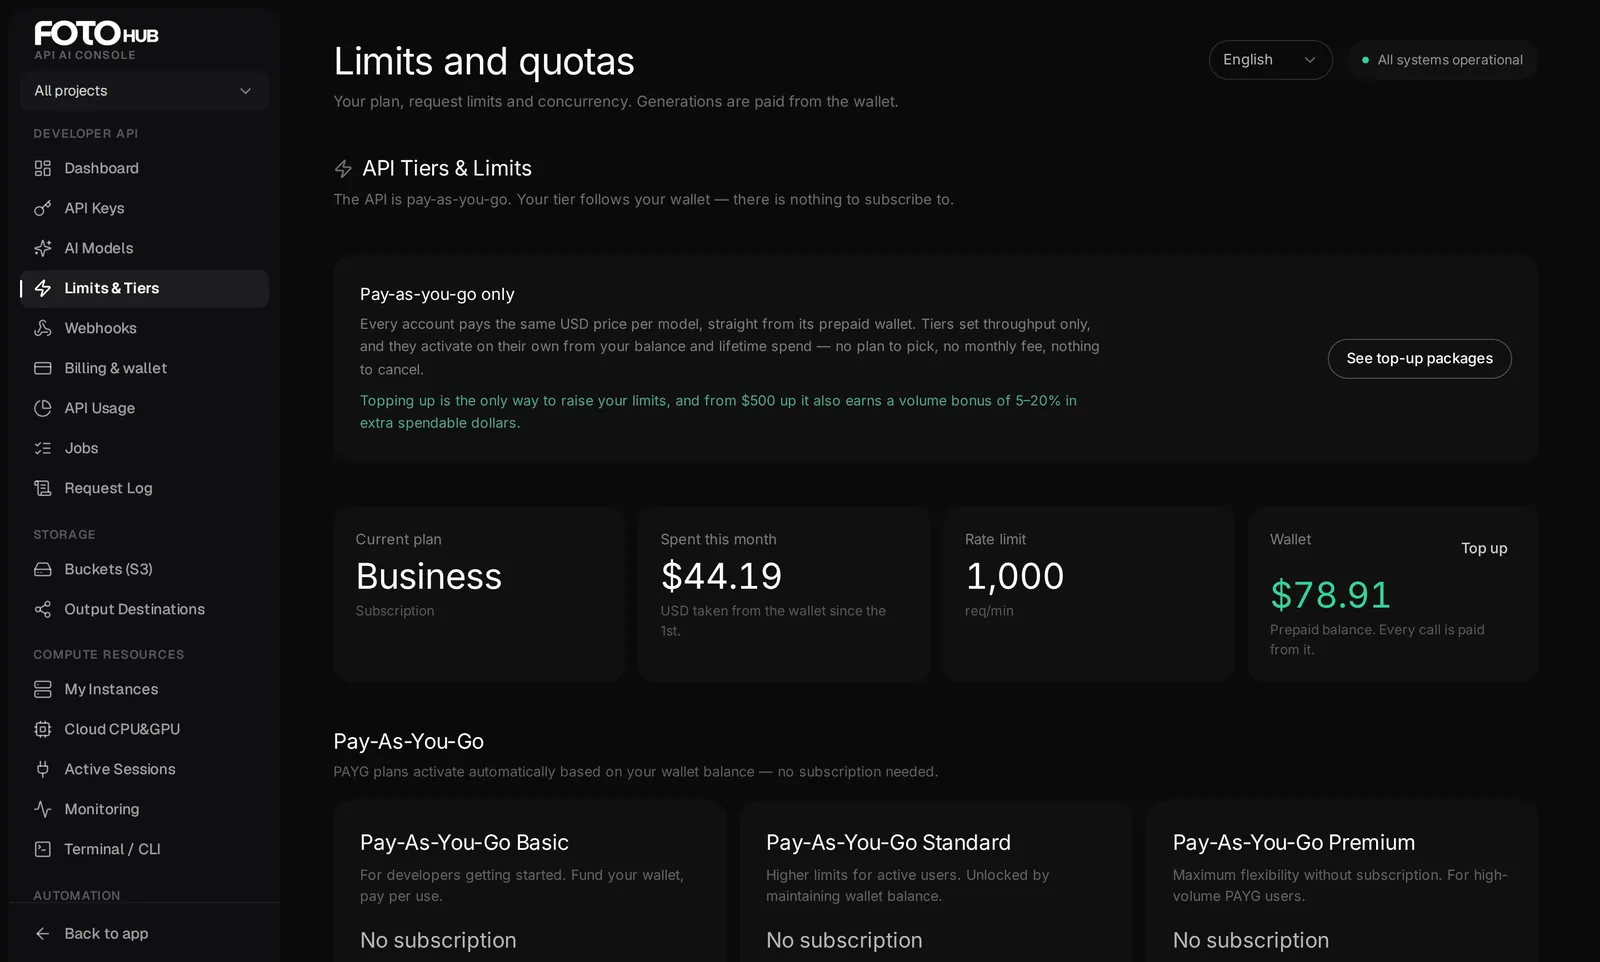
| Tier | Requests/min | Concurrent jobs | Storage | Switches on at |
|---|---|---|---|---|
| Basic | 30 | 3 | 5 GB | start tier |
| Standard | 120 | 10 | 50 GB | balance $25 or lifetime spend $50 |
| Premium | 500 | 30 | 200 GB | balance $120 or lifetime spend $500 |
Values as on the tab when written; the tab is the authority. A reached tier stays on for a while after the balance drops, and the tab shows the date.
Billing & wallet, API Usage
Billing & wallet is where money enters and where you see it leave: the available balance, pending payments, spend and top-ups this month, a spending cap and budgets, the top-up options and the list of recent movements. The balance never expires. When it cannot cover a request the API answers 402 insufficient_funds, and with exactly zero left 403 api_access_required; nothing is charged.
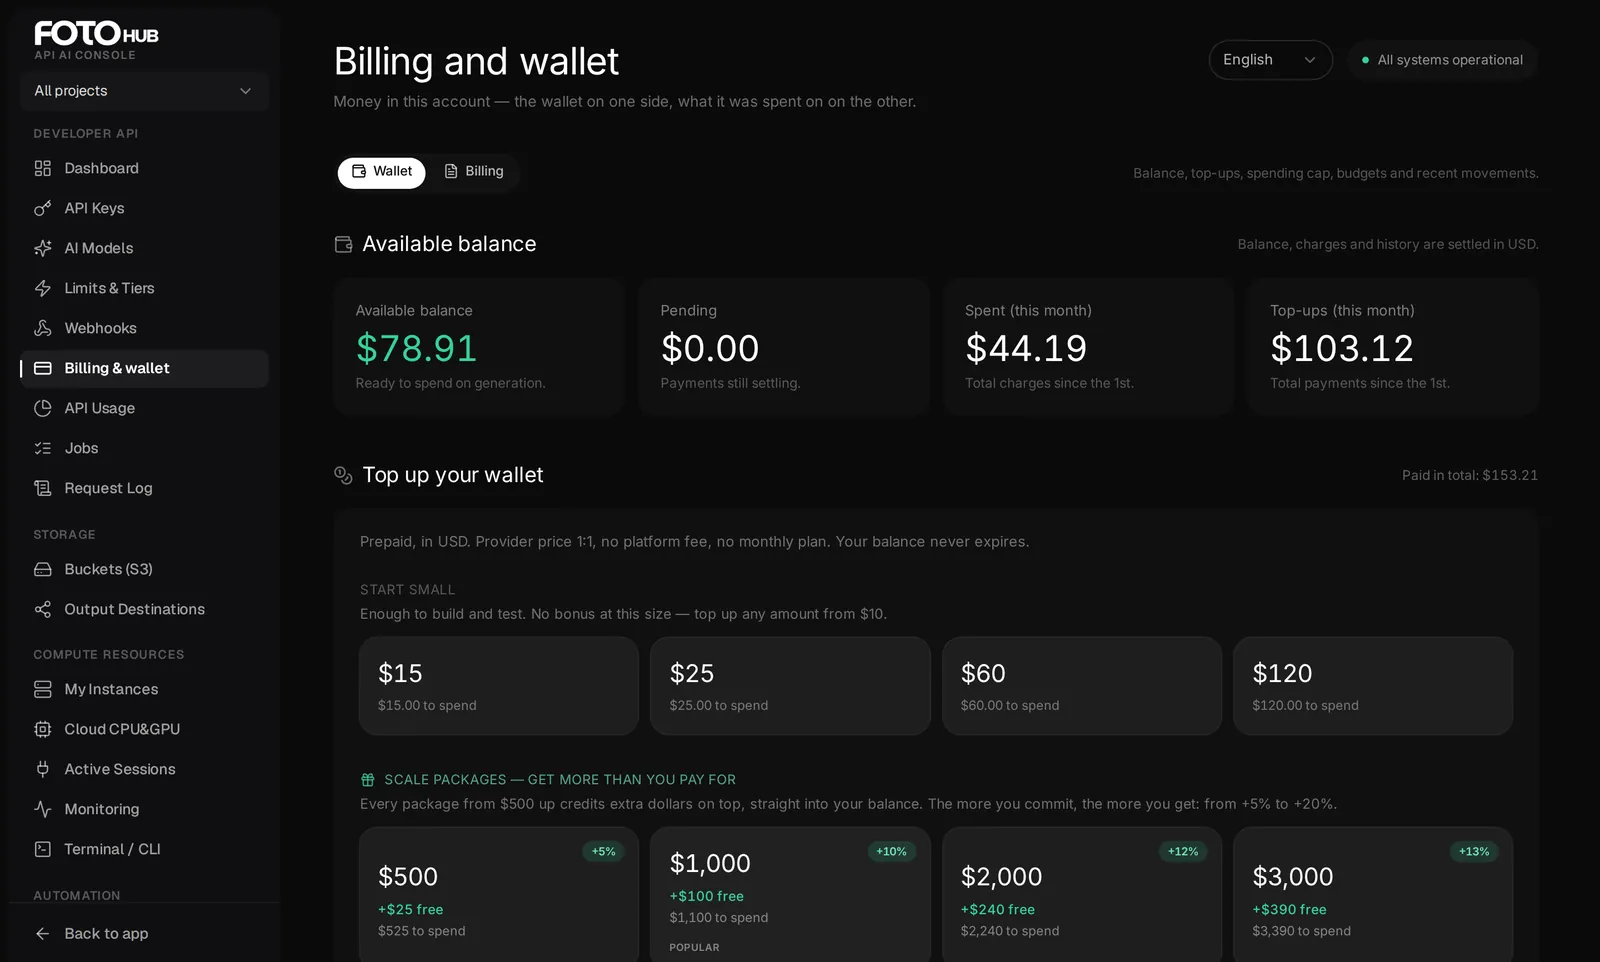
- Top up starts at $10; from $500 up, packages credit 5 to 20 percent extra spendable dollars, and a custom amount earns the same bonus as a package of its size. The wallet is always USD; Payment currency only changes what Stripe charges, and PLN is converted at the live NBP rate.
Spending cap and budgets
The spending cap is a monthly ceiling you set on your own spend. Enter USD and choose Save cap, or leave it empty for none. A request that would take the month past the cap is refused with 402 and the code spend_limit_reached before any provider work starts; the message ends "Your wallet was not charged." Through the API, a Write or Admin key sets it with PUT /v1/billing/overage-limit; sending a project_id caps one project, and that overrides the account cap for its keys.
curl -s -X PUT https://apis.fotohub.app/v1/billing/overage-limit -H "Authorization: Bearer $FOTOHUB_API_KEY" -H "Content-Type: application/json" -d '{"hard_limit_usd": 50}'Cap the account at 50 USD a month; the response is { "hard_limit_usd": 50.0, "project_id": null }
A budget only warns and never blocks. New budget takes a name, a USD amount, a period (Monthly or All time), whole-percent thresholds from 1 to 100 and an optional email. Spend is recalculated every two hours, so a new budget reads "not measured yet" until the first run.
API Usage breaks the same window down for analysis: requests by endpoint and by model with call counts, failures and p50/p95/p99 latency, spend by category, and a cost estimator for planning. Use Export CSV to take the numbers to a spreadsheet.
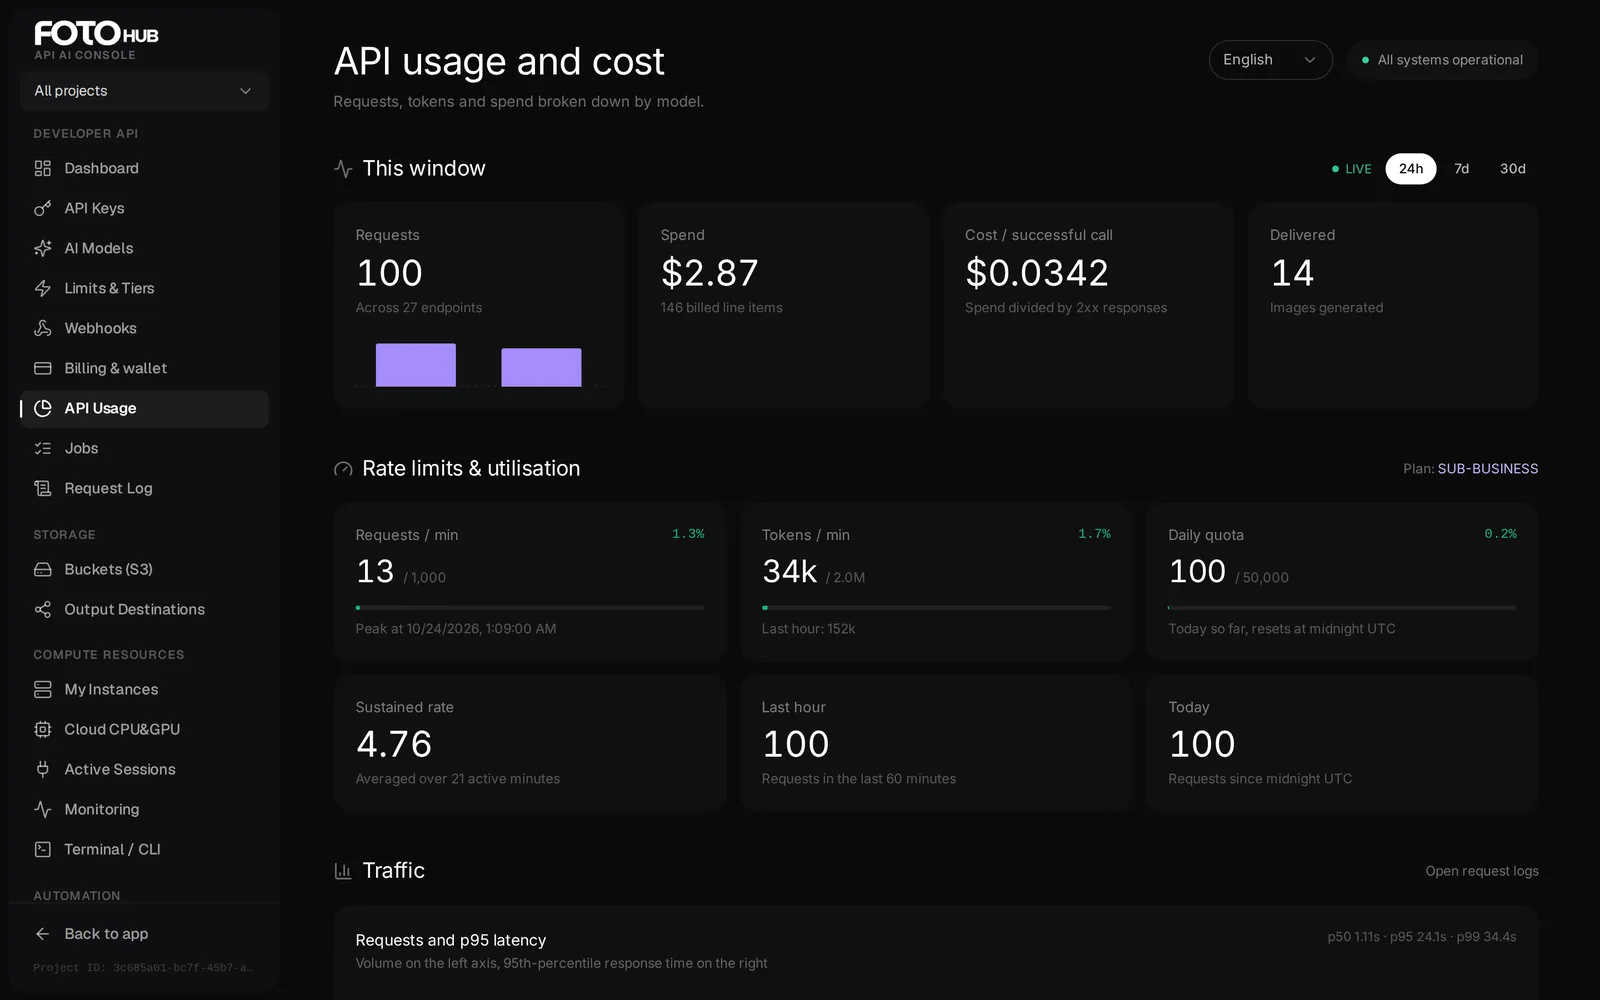
Read API Usage top to bottom: window totals, then Rate limits & utilisation (busiest minute, tokens per minute and today's requests against your plan), then the Breakdown. By model adds Billed, the number of charges the ledger recorded, and Cost: divide Cost by Billed, not by the request count, to get a unit price.
Jobs and the Request Log
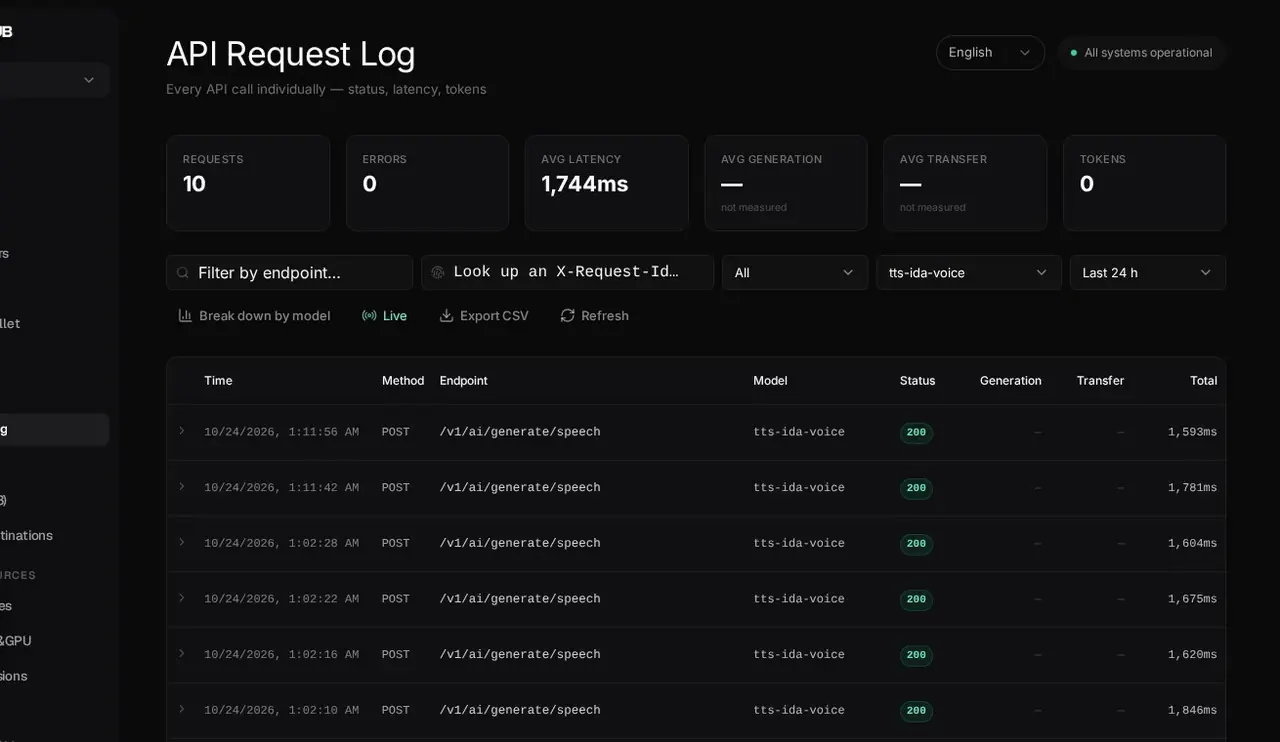
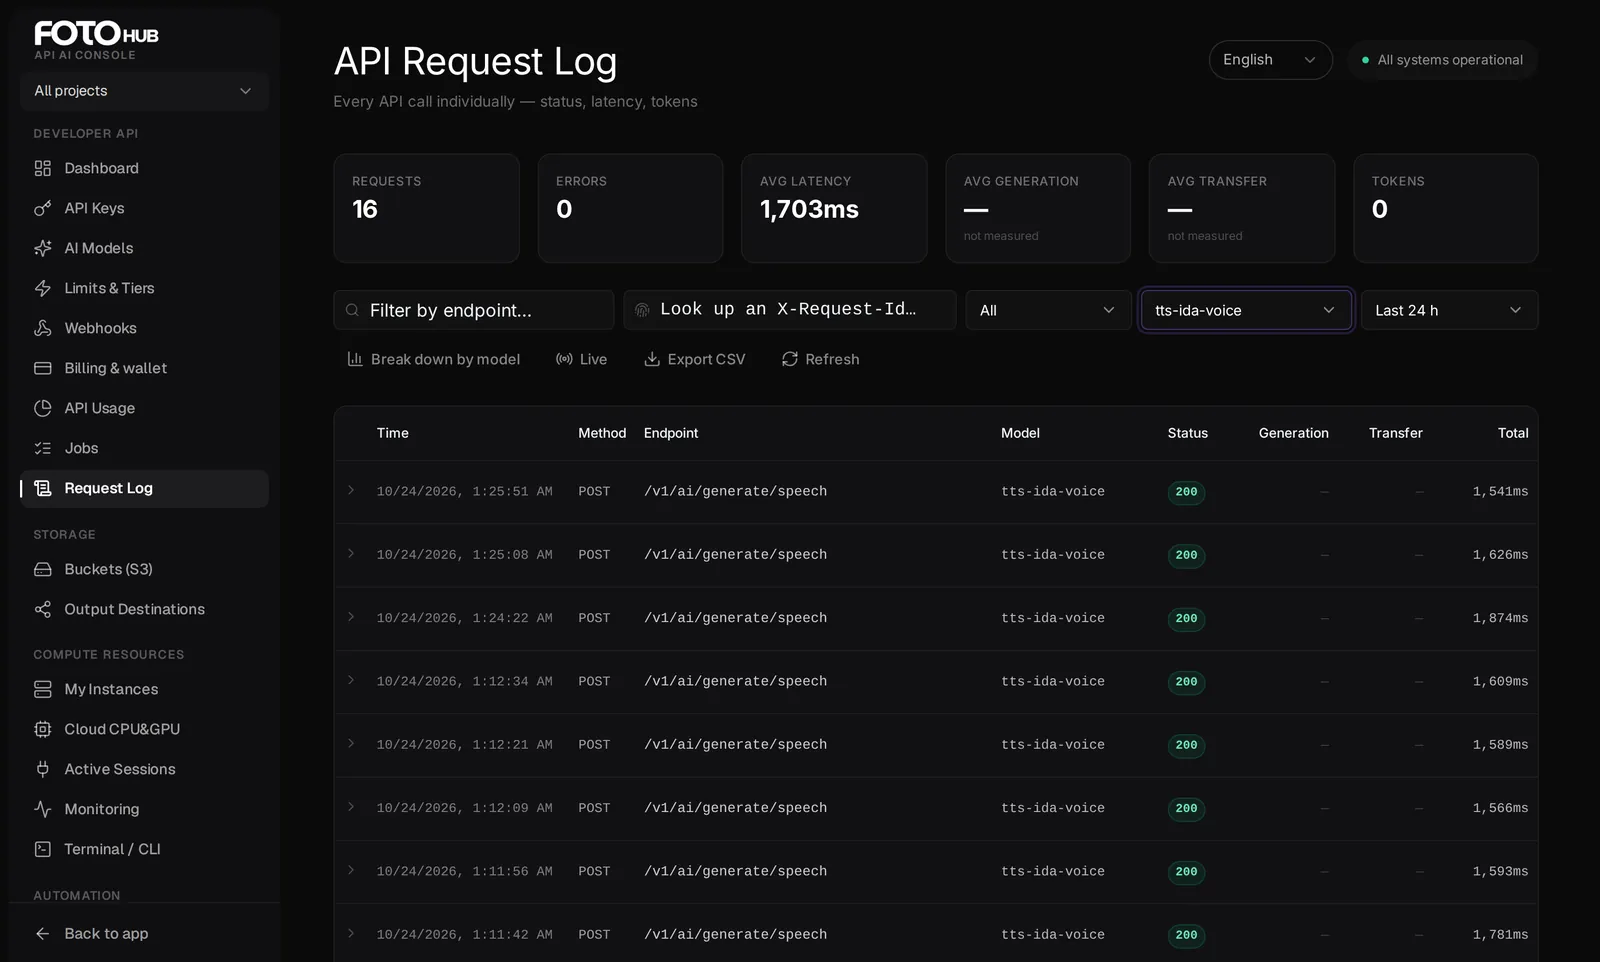
These two tabs are where you debug. Request Log lists every API call individually: time, method, endpoint, model, status, generation time, transfer time and total. The summary strip above the table gives requests, errors, average latency and tokens. Filter by status, model and period, switch Break down by model, turn on Live to watch calls arrive, and Export CSV for offline work.
| Control | Behaviour |
|---|---|
| Successful / Errors | Successful is status below 400, Errors is 400 and above. |
| Range | Last 24 h, 7 days or 30 days; disabled during a Request ID lookup. |
| Filter by endpoint… | Substring match: image finds every endpoint containing it. |
| Break down by model | Per-model table over the latest 5000 calls of the range. |
| Live, Load more, Export CSV | Live refreshes every 10 seconds. A page is 100 rows and Load more adds 100; the summary strip and the CSV cover the rows loaded, not the whole range. |
Click a row to expand it: model, provider, your Request ID and a timing split in which Provider render, Fetch + store and FOTOhub orchestration add up to the Total round trip. A dash in Generation or Transfer means that path does not time its phases; the CSV leaves those cells empty instead of writing 0.
Look up a call by its X-Request-Id
Every API response carries an X-Request-Id header. We mint it per call and never accept one from the client. Paste it into the box above the table and the log shows that call alone, from any date, ignoring the range. Only a complete UUID is searched. One id can return two rows when a handler logged a success and then failed. Rows from before ids were recorded show a dash.
Jobs is the asynchronous view. It lists the asynchronous image jobs and the long-clip video jobs you submitted through the API, with their type, model, the job id and poll route, status, how long it took, what was charged and which key submitted it. A failed job shows as refunded. Other video models report their job through the poll route and the Request Log instead. Filter by status, type and period; jobs created in the web app are hidden unless you switch the source to everything on the account.
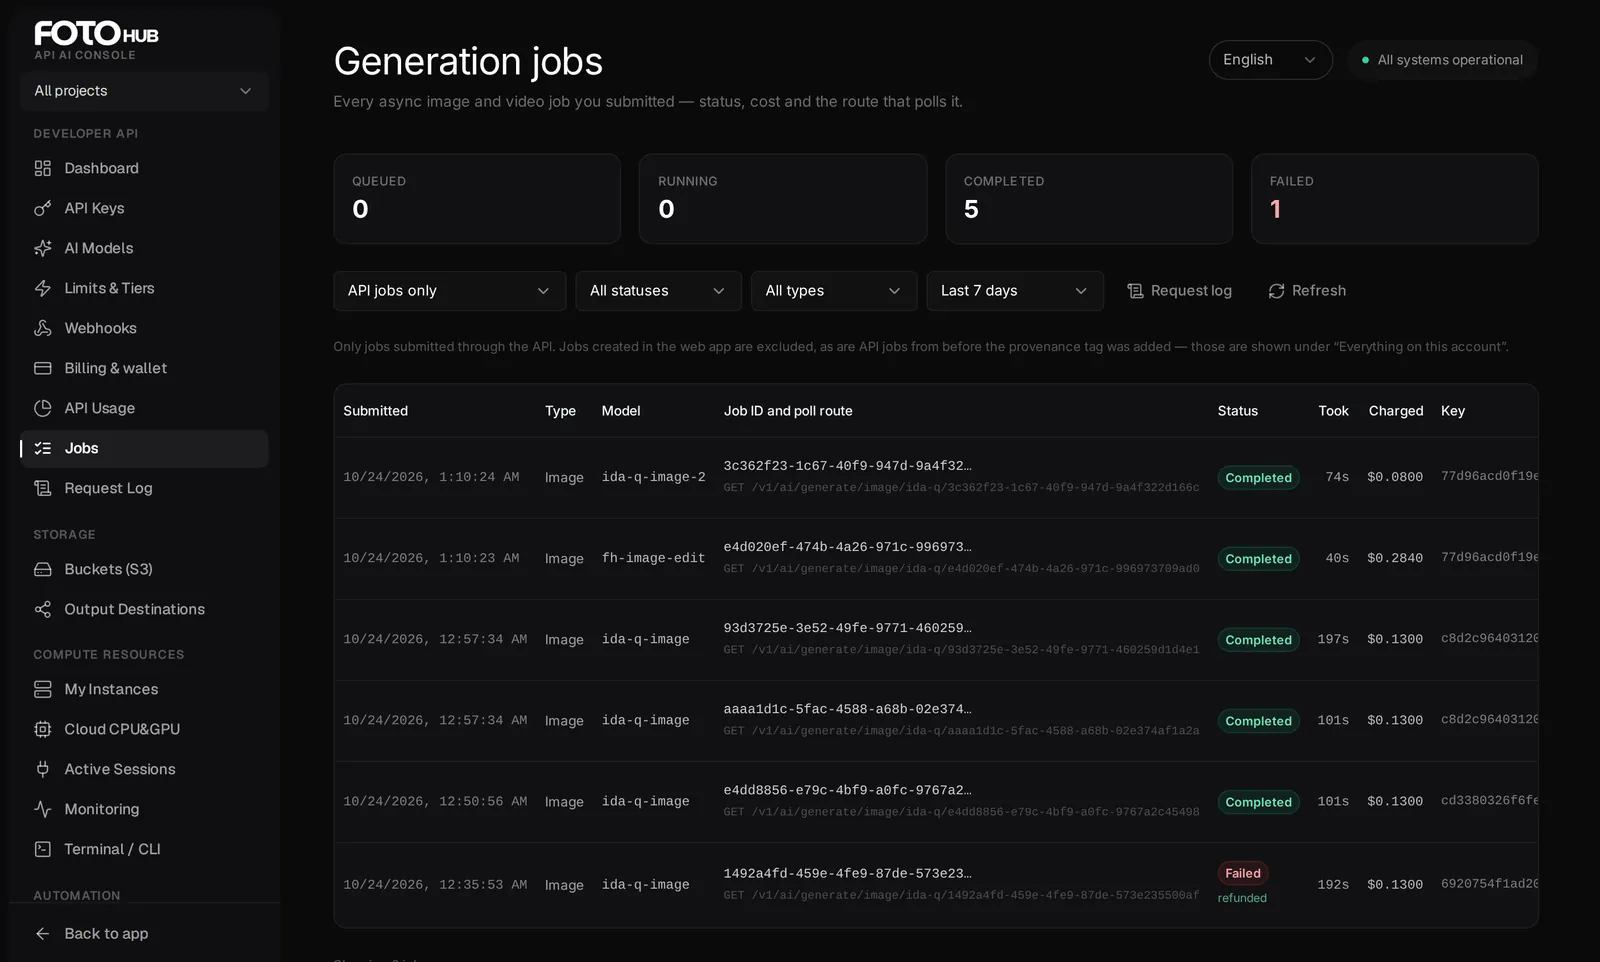
| Column | What it tells you |
|---|---|
| Job ID and poll route | the id (copy button) and the GET route that returns the job |
| Status | Queued, Running (with percent), Completed or Failed; Failed includes cancelled, and a refunded job is marked |
| Took, Charged | seconds from submission to completion (empty while running), and the cost in dollars |
| Key | the id of the submitting key; a dash for jobs from before keys were recorded |
The page refreshes itself every 15 seconds, and Range defaults to 7 days. Lost a job id? Find the row by its Submitted time and Key, copy the id and call the route under it. The same list is GET /v1/console/jobs with your API key.
Find out why a call failed
Goal. A customer reports that image generation "did nothing" at about 14:05.
Input you can copy.
1. Open Request Log, set the period to Last 24 h and filter the status to errors.
2. Find the row near 14:05 and read the endpoint, model and status.
3. A 402 means the wallet was empty; a 429 means a rate limit; a 424 or 5xx means the engine failed and the message says whether it was charged.
4. For an asynchronous model, open Jobs and look for the same time: a failed job shows `refunded`.
Why it works. The log tells you what the platform saw; the response body of the same call (kept by your code) tells you why. Together they usually end the conversation in minutes.
Trace one call from the response header
Goal. Your code logged a failure and you want the platform's view of exactly that call.
Input you can copy.
Store the X-Request-Id response header next to every error (the blocks below read one). Paste it into Look up an X-Request-Id in Request Log and expand the row.Why it works. The id ties your log line to ours without guessing by time. It is the same in the header, the Request ID field and the CSV, and the search ignores the date range, so it works for a failure you notice days later.
curl -si https://apis.fotohub.app/v1/billing/balance -H "Authorization: Bearer $FOTOHUB_API_KEY" | grep -i '^x-request-id'Read the request id of a call
x-request-id: 8d08384d-2710-44e5-b32a-c8e12954ab9bExample output from a real call; every call gets its own id
Webhooks, storage and output destinations
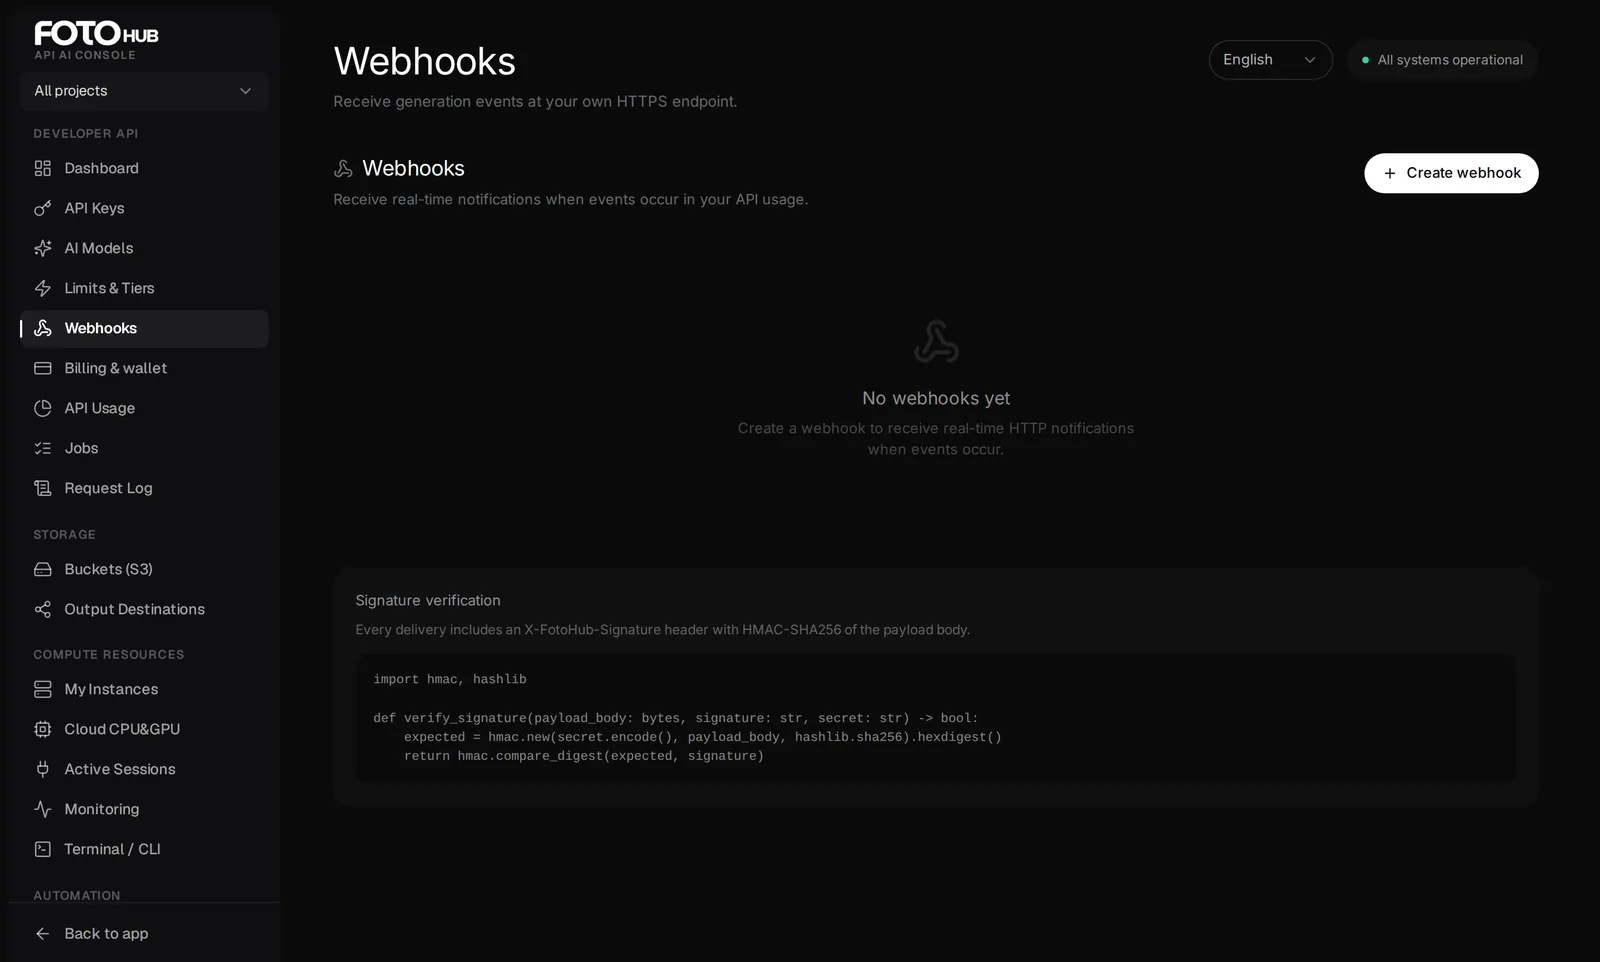
Webhooks registers HTTPS endpoints that receive events from your account, with Test and Logs for each; the webhooks guide covers it fully.
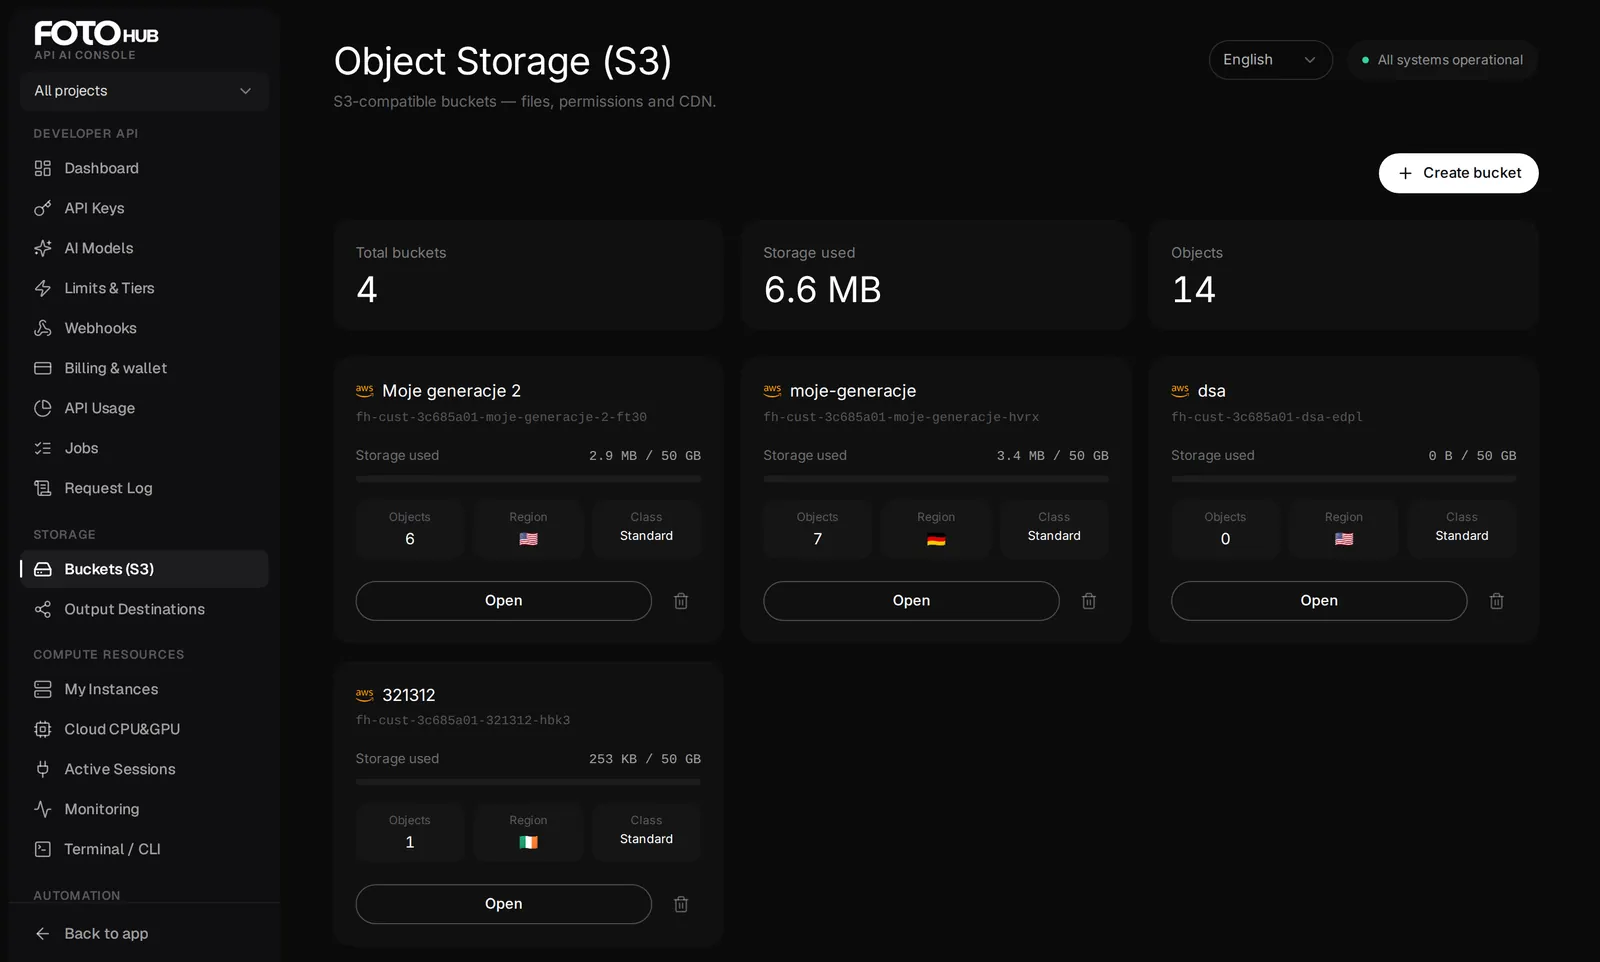
Buckets (S3) lists the S3-compatible buckets you own, with used space, object counts, region and storage class, and opens each bucket for files, access keys, public URLs, CDN and more. Output Destinations connects a bucket that should receive everything an API key generates, instead of FOTOhub storage; a key's Output tab chooses which destination it uses.
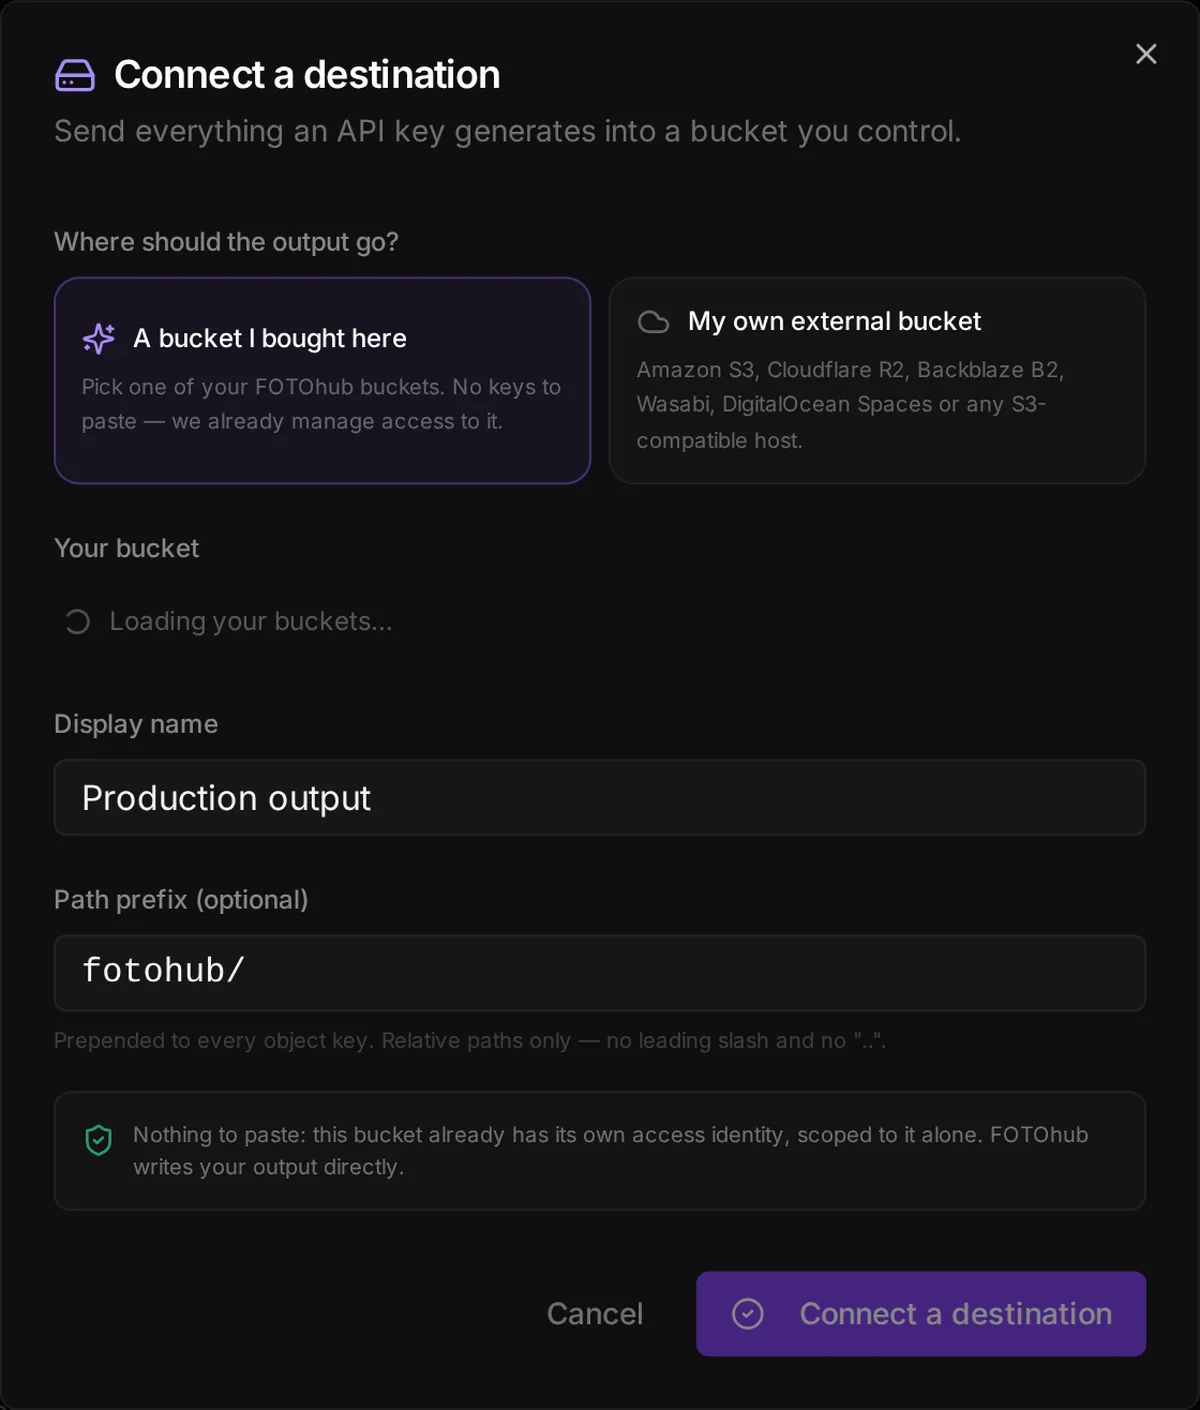
A destination can be one of your FOTOhub buckets (no credentials to paste) or any S3-compatible bucket you own elsewhere. It shows a verified status, can be re-checked at any time, and lists the keys and per-model rules that point at it.
A destination card shows its verified status with a Re-check button, writes, bytes delivered, the keys that write there and the per-model rules that point at it, each with a path template such as public/image/{date}/{job_id}-{index}.{ext}. Precedence: an output object in the request, then a per-model rule on the key, then the key's default destination, then FOTOhub's private storage with a signed URL.
Terminal / CLI, Agents API and compute
Terminal / CLI gives the install command for the official command-line client, a quick start (launch fotohub, sign in with /login, generate an image, chat, check billing) and cards for the main command groups. The CLI has its own guide.
Install with npm install -g fotohubapp-cli (Node.js 18 or later); the command is fotohub, and --json makes the output script-friendly.
Agents API documents how to run agent workflows programmatically with the same key: start a run (POST /engine/v1/runs), list workflows, read run status and follow events as server-sent events. The Compute Resources group lists machine rentals (instances, a catalogue of CPU and GPU machines, sessions and monitoring). Those tabs are outside this guide.
| Endpoint | What it does |
|---|---|
| POST /engine/v1/runs | starts a run; needs a workflow_id, takes an input |
| GET /engine/v1/workflows | lists your workflows |
| GET /engine/v1/runs/:id | run status with nodes and events (/events streams them) |
| POST /engine/v1/schedules | cron schedule for a workflow; a second active one for an agent returns 409 schedule_already_armed |
The console is also an API
Several tabs read from plain endpoints, so a script, a cron job or the CLI can watch the same data. The log, its per-model summary, the job list and the system status accept your API key as well as your console sign-in. The dashboard, usage and project endpoints answer only to the console's own sign-in; an API key gets a 401.
| Console view | Endpoint | Credential |
|---|---|---|
| Request Log | GET /v1/console/logs, /v1/console/logs/summary | API key or sign-in |
| Jobs | GET /v1/console/jobs | API key or sign-in |
| Wallet, activity | GET /v1/billing/balance, /v1/billing/transactions | API key |
| Dashboard, API Usage | GET /v1/console/overview, /v1/console/usage/realtime | sign-in only |
GET /v1/console/logs takes limit (default 100, at most 500), offset, status (all, success or error), endpoint, model, request_id (a UUID, else 400) and hours (default 24, at most 720), and returns logs, limit, offset and has_more. A row has request_id, endpoint, method, status_code, latency_ms, tokens_used, created_at, model, provider, generation_ms, transfer_ms and meta; the two timings are null, never 0, when unmeasured. GET /v1/console/jobs takes status, kind, model, hours (default 168, at most 2160) and source (api or all), and returns jobs with poll_url and was_refunded.
curl -s "https://apis.fotohub.app/v1/console/logs?status=error&hours=24&limit=20" -H "Authorization: Bearer $FOTOHUB_API_KEY"The last 20 failed calls of the past day, the same rows as Request Log with Errors selected
Troubleshooting and common questions
- Do I need the console to use the API?
- Only to create the first key and top up. After that your code talks to
apis.fotohub.appdirectly, and the console is for watching and housekeeping. - Why are my web app generations missing from the Request Log?
- The log is for API calls with a key. Work you do in the studios is billed to the web app and appears in your activity there.
- The overview shows a success rate far below 100%. Is something broken?
- Not necessarily. The share is 2xx responses over all requests, so rejected requests count as failures too. Open the Reliability panel and the log filtered by errors to see whether they are 4xx (your requests) or 5xx (the platform).
- The Request Log shows no requests for a call I just made.
- "No request matches the filters" means a status, model, endpoint or Request ID filter hides the row: clear them. "No requests in the selected range" means the range is empty: widen it, press Refresh or switch Live on. Also check you are signed in to the account that owns the key.
- Jobs says "No jobs in this range" but I submitted some.
- Check Source: API jobs only hides web-app jobs and API jobs from before they were tagged, which appear under Everything on this account. The default range is 7 days.
- A call got 402 although my wallet has money.
- Check the Spending cap: a call that would push the month past it is refused with
spend_limit_reachedand not charged. A balance too low for the request givesinsufficient_funds, and a wallet at exactly zero gets 403api_access_required.
Next, read the guides on API keys, errors and limits, webhooks, and the public API quickstart.